
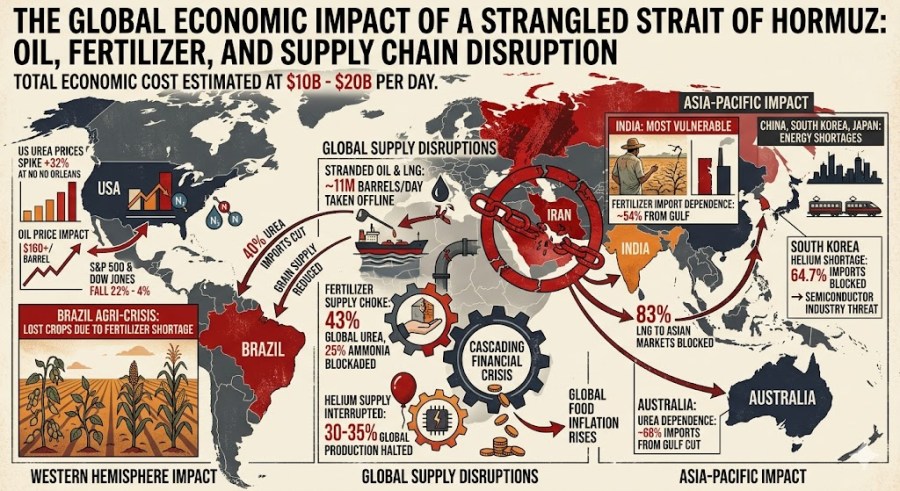
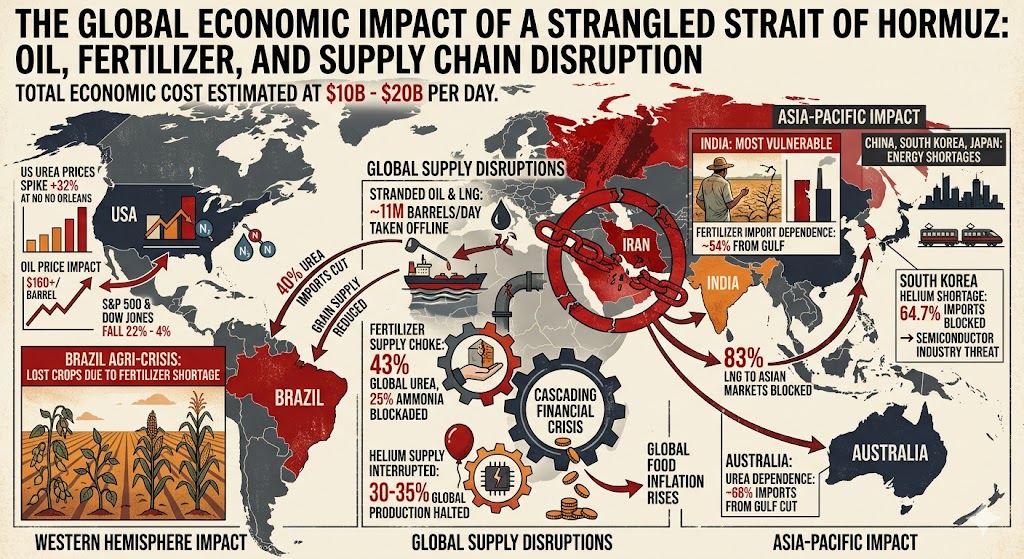
The closure of the Strait of Hormuz is being felt across every major global sector, primarily because the Strait is the world’s most critical “energy and agricultural lung.”
Who is Affected?
The impact is divided into two groups: those who can’t get their goods out and those who can’t get essentials in.
- Exporting Nations (The Sellers):
- Iraq, Kuwait, and Qatar: These nations are seeing their economies strangled. Iraq, for instance, relies on the Strait for 90% of its GDP. Qatar has been forced to declare “force majeure” on its liquefied natural gas (LNG) exports.
- Saudi Arabia and the UAE: While they have some pipelines that bypass the Strait, the bulk of their oil and specialized fertilizer (phosphate) is stuck.
- Importing Nations (The Buyers):
- China, India, Japan, and South Korea: These are the hardest hit. They account for 75% of the oil and 59% of the LNG that normally flows through the Strait.
- India is in a particularly tight spot; it relies on imported LNG to run its domestic fertilizer plants, which are now cutting production.
- Europe: Already struggling with energy security, European nations are facing a “severe energy-supply shock” that the European Central Bank warns will lead to stagflation (high prices with no economic growth).
The Commodities Cut Off
While oil is the headline, the “hidden” losses in fertilizers and industrial materials are what will drive up the cost of living globally.
| Category | Specific Goods Affected | Global Impact |
|---|---|---|
| Energy | Crude Oil, Gasoline, LNG | Brent Crude has surged past $120/barrel. |
| Fertilizer | Urea and Ammonia | The region provides 46% of the world’s traded Urea. Prices are up 28% in just three weeks. |
| Agriculture | Corn, Wheat, Soybeans | The lack of fertilizer is expected to cause global food inflation of 4–5% by late 2026. |
| Industrial | Aluminum, Methanol, Sulfur | Half of all seaborne sulfur passes through the Strait; without it, global chemical and plastic production slows. |
Total World Costs
The financial toll is staggering and mounting daily:
- Direct GDP Loss: It is estimated that the conflict and closure will reduce the GDP of Arab nations by $120–$194 billion.
- Daily Shipping Costs: Freight rates are expected to rise by as much as 65% compared to February levels.
- Humanitarian Cost: For the Gulf states (GCC), the closure is a “grocery emergency,” as they import 70–80% of their food through the Strait.
Why Trump’s “Whimsical” Total Closure?
The shift from a “monitored” strait to a total naval blockade—what you called a “whimsical change”—was triggered by two main factors following the collapse of the Islamabad talks:
- “World Extortion”: Trump accused Iran of using the Strait for “world extortion” by demanding illegal tolls of up to $2 million per ship. He declared that the U.S. would not be extorted and would block any ship attempting to pay these fees.
- The “Invisible” Mine Threat: Iran claimed they had lost track of naval mines they planted, effectively saying “pass at your own risk”. Trump viewed this as a bluff to control the waterway without a formal navy. He ordered the blockade to “clear the mines” and ensure that if the Strait isn’t open for free, fair trade, it won’t be open for Iranian-taxed trade either.
In his own words, he is looking for an “all being allowed in, all being allowed out” scenario, but until Iran stops the nuclear program and the “toll” system, the U.S. Navy will keep the doors locked.
In the fertilizer industry, Global Urea typically refers to the international market and supply chain of urea, which is the most widely used nitrogen fertilizer in the world. It is valued for its high nitrogen content—approximately 46%—making it a highly concentrated and cost-effective nutrient source for crops like rice, wheat, and corn.+1
As of early 2026, the global urea market is characterized by significant volatility due to geopolitical tensions and logistical disruptions.
Key Characteristics of Urea
- Composition: It is a solid nitrogen fertilizer produced by reacting ammonia with carbon dioxide under high pressure.
- Form: It is primarily sold as granular or prilled (small spheres). Granular urea is more common globally because it is easier to handle, store, and spread with modern equipment.
- Efficiency: While rich in nitrogen, it can be inefficient; roughly 30–35% can be lost to the environment through “volatilization” (turning into gas) if not applied correctly.
The 2026 Global Market Landscape
The “Global” aspect of urea is critical because production is concentrated in a few energy-rich regions, while demand is spread across every agricultural nation.
| Feature | 2026 Market Status |
|---|---|
| Leading Producers | China (projected 76.5 million tonnes), India, the Middle East, and the U.S. |
| Major Consumers | The Asia-Pacific region accounts for over 50% of global consumption. |
| Current Pricing | Prices surged to over $700 per metric tonne in April 2026 due to shipping disruptions in the Strait of Hormuz. |
| Cost Drivers | Natural gas accounts for 60–80% of total production costs. |
Why It Matters Globally
- Food Security: Over 65% of global cereal production (like the wheat and corn grown in Texas and the Midwest) relies on nitrogen-based fertilizers, with urea being the primary source.
- Industrial Use: Beyond the farm, “technical grade” urea is used to make diesel exhaust fluid (DEF/AdBlue) to reduce truck emissions, as well as in plastics, resins, and adhesives.
- Trade Sensitivity: Because it is a global commodity, a disruption in one area (like export restrictions in China or conflict in the Middle East) immediately impacts fertilizer prices for farmers worldwide.
The effective closure of the Strait of Hormuz since March 2026 has caused a massive operational and financial shock to the global container shipping industry. Beyond the immediate local impact on the GCC, the disruption has triggered a “cascading effect” that is reshaping global trade routes and driving up consumer prices worldwide.
Here is how container ships and their operations are being impacted as of April 2026:
1. Global Capacity and Freight Rates
The closure has essentially removed a significant portion of the world’s shipping capacity from the market.
- Stranded Vessels: Roughly 1.5% of global container capacity remains physically stranded inside the Persian Gulf. In the initial hours of the crisis, approximately 170 containerships were trapped behind the chokepoint.+1
- Freight Rate Surges: Global freight rates have jumped significantly. For instance, transatlantic rates rose 25% in a single week in early April. Analysts expect overall rates could settle at levels 65% higher than those seen in February 2026.+1
- Fuel Surcharges: Carriers are implementing “emergency bunker surcharges” as global fuel costs rise, further inflating the cost of moving goods.
2. Massive Rerouting (The Cape of Good Hope)
Because the Strait is de facto closed to most commercial traffic, vessels must take the long way around Africa.
- Extended Transit: Rerouting around the Cape of Good Hope adds 10 to 14 days to a typical voyage.
- Increased Costs: Each diverted voyage costs an estimated $1 million extra in fuel alone.
- Congestion: The shift in schedules is causing “cascading delays” at ports far removed from the Middle East, such as New York and Savannah, as arrival windows become unpredictable.
3. The “Insurance Chokepoint”
Even if the physical waterway were cleared, ships cannot sail without financial coverage.
- Sky-High Premiums: War-risk insurance premiums have leaped to 5% of a ship’s total value. To put this in perspective, insuring a $100 million vessel now costs $5 million per transit—a cost so high it makes shipping many goods economically impossible.+1
- Coverage Withdrawal: Some major insurers have canceled coverage for the region entirely, making the risk prohibitive for the world’s largest carriers like Maersk and MSC.
4. Operational Standoff and “Limited” Transit
While a temporary ceasefire was recently announced (April 2026), shipping has not returned to normal.
- Iranian Control: Iran is reportedly requiring ships to be approved by the IRGC and is attempting to collect “transit fees”.
- Carrier Boycotts: Major lines like Hapag-Lloyd continue to avoid the Strait, stating that the safety of crews remains the top priority despite political headlines suggesting the route is “open”.
- Priority on Exit: Carriers currently prioritize getting trapped vessels out of the Gulf rather than sending new ships in.
Impact Summary for Shipping Lines
| Metric | Status as of April 2026 |
|---|---|
| Daily Traffic | Plummeted by ~70-80% |
| Insurance Cost | Up to 5% of hull value (~5x increase) |
| Transit Time | +14 days for rerouted vessels |
| Global Trade Growth | Projected to slow from 4.7% to ~2.0% |
As of early 2026, Americans are already grappling with a renewed surge in the cost of living, driven largely by geopolitical instability and structural economic shifts. Financial forecasts for the remainder of the year suggest that “affordability” will remain a dominant and painful theme for most households.
Below are the full details of the factors contributing to high costs by the end of 2026:
1. Energy and Transportation Spikes
The most immediate shock in 2026 has been driven by conflict in the Middle East (specifically involving Iran), which triggered a significant oil price shock.
- Gasoline: In March 2026 alone, gasoline prices surged by 21.2%, accounting for nearly three-quarters of the overall monthly inflation increase.
- Energy Index: The broader energy index rose 12.5% over the 12 months ending in March 2026.
- Travel: High fuel costs have cascaded into the travel sector, with airline fares up 14.9% year-over-year.
2. The Persistent Housing Crisis
While home price growth is expected to stall at 0% nationally through 2026 due to high interest rates, the “affordability gap” has reached historic levels.
- Income Gap: As of early 2026, a median-income household ($85,000) falls far short of the $120,000 income now required to qualify for a mortgage on a median-priced home.
- Rent and Shelter: The shelter index increased 3.0% over the last year. For many young adults, the prospect of homeownership has receded so far that it is impacting their long-term savings behavior.
- Utilities: Household utility costs have risen dramatically over the last five years: electricity is up 32%, water 43%, and natural gas 60%.
3. Food and Grocery Inflation
Food prices are predicted to rise by 3.6% overall in 2026, faster than the 20-year historical average.
- Specific Hits: Notable year-over-year increases include sugar and sweets (+9.8%), fresh vegetables (+4.8%), and beef and veal (+14.4% as of February).
- Dining Out: The “food-away-from-home” index (restaurants) is expected to rise 3.9%, making casual dining an increasingly expensive luxury.
4. Erosion of Financial Safety Nets
Unlike the inflation spike of 2022, Americans in 2026 are facing these costs with much thinner cushions:
- Savings Rate: The personal savings rate has dropped to 4%, down from 7.5% pre-pandemic and a high of 21.6% in 2021.
- Debt: Many Americans are now borrowing to cover basic necessities and are finding it increasingly difficult to keep up with high-interest debt payments.
- Real Earnings: In March 2026, real earnings (wages adjusted for inflation) decreased by 0.6%, meaning even those with raises are losing purchasing power.
Economic Outlook Summary
| Category | 12-Month Change (as of March 2026) |
|---|---|
| Overall Inflation (CPI-U) | +3.3% |
| Energy | +12.5% |
| Gasoline | +18.9% |
| Food at Home | +1.9% |
| Airline Fares | +14.9% |
| Social Security COLA | +2.8% (for 2026) |
With inflation projected by some markets to potentially hit 4% before the year ends, the “sticker shock” is likely to remain a central issue for the American public through the 2026 midterm elections.

You must be logged in to post a comment.