
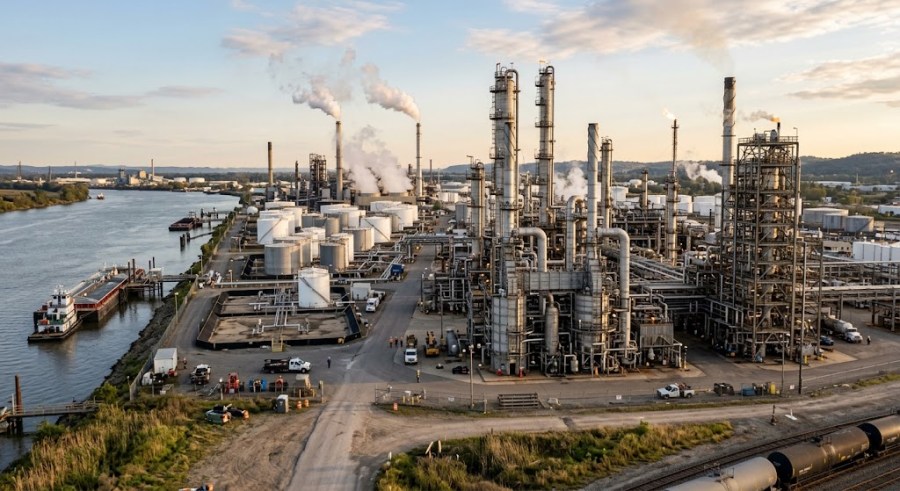
The World is growing desperate for Oil!
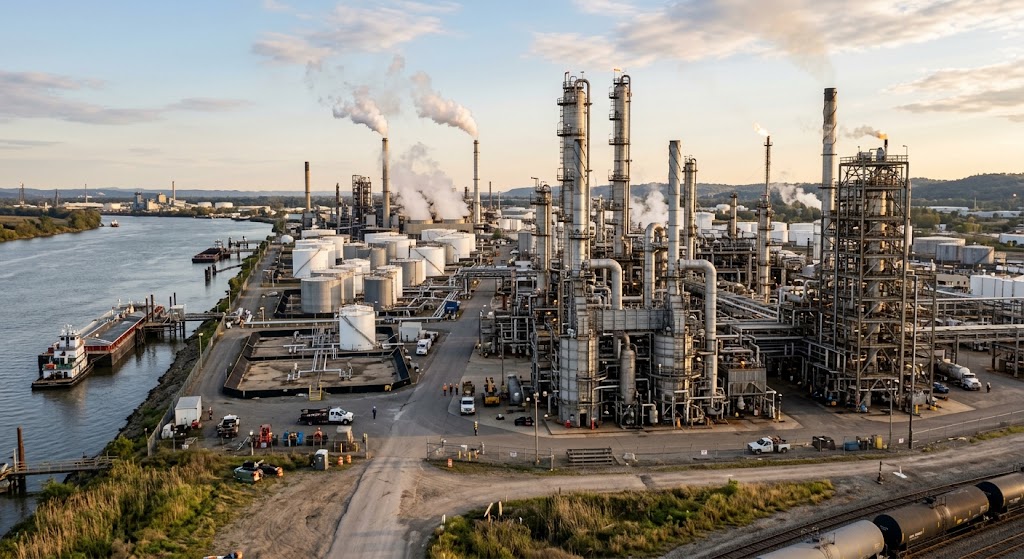
According to the U.S. Energy Information Administration (EIA), there are 130 operable petroleum refineries in the United States:
EIA
- Operating: 128
- Idle: 2
Together, they provide approximately 18.2 million barrels per calendar day (b/cd) of operable atmospheric crude oil distillation capacity.
EIA
Key Details
- Geographic Concentration: Over 50% of total U.S. refining capacity is concentrated along the Gulf Coast (PADD 3), primarily in Texas and Louisiana.
- Recent Changes: Operable capacity declined from 132 refineries due to major facility closures, notably LyondellBasell’s Houston, Texas refinery and Phillips 66’s Los Angeles, California complex. EIA
- Largest Facilities: Motiva Enterprises’ refinery in Port Arthur, Texas (the largest by calendar-day capacity at ~656,000 b/cd) and Marathon Petroleum’s Galveston Bay refinery in Texas City. EIA
The official count from the U.S. Energy Information Administration (EIA) reports the number of operable petroleum refineries (both operating and idle facilities, measured as of January 1 each year):
| Year (as of Jan 1) | Operable Refineries | Operating | Idle | Total Operable Capacity (Million b/cd) |
|---|---|---|---|---|
| 2017 | 141 | 137 | 4 | ~18.6 |
| 2018 | 141 | 135 | 6 | ~18.6 |
| 2019 | 135 | 132 | 3 | ~18.8 |
| 2020 | 135 | 129 | 6 | ~19.0 |
| 2021 | 129 | 124 | 5 | 18.1 |
| 2022 | 130 | 125 | 5 | 17.9 |
| 2023 | 129 | 124 | 5 | 18.1 |
| 2024 | 132 | 132 | 0 | 18.4 |
| 2025 | 132 | 131 | 1 | 18.4 |
| 2026 | 130 | 128 | 2 | 18.2 |
Key Trends
- Net Closures: Between 2019 and 2021, pandemic demand drops and energy transition strategies triggered multiple permanent closures or conversions into renewable fuel hubs (e.g., Philadelphia Energy Solutions, Shell Convent in Louisiana, and Phillips 66 Rodeo in California).
- 2024 Survey Adjustment: The slight jump from 129 in 2023 to 132 in 2024 was primarily a data definition change; the EIA broadened its survey to include several standalone facilities that produce petroleum blending components.
- Recent Decommissioning: In 2025, two major historical facilities ended crude processing—LyondellBasell’s Houston refinery and Phillips 66’s Los Angeles refinery—reducing the count to 130 entering 2026.
In the energy sector, “reserves” generally refers to two distinct measurements: underground proved reserves (oil still in the ground that is economically recoverable) and stored inventory/strategic reserves (oil already extracted and sitting in tanks or salt caverns).
1. Above-Ground Storage & Strategic Reserves According to the latest weekly data from the U.S. Energy Information Administration (EIA):
- Strategic Petroleum Reserve (SPR): ~286.6 million barrels. Managed by the Department of Energy in underground salt caverns along the Texas and Louisiana coasts, this represents roughly 40% of its 714-million-barrel authorized storage capacity.
- Commercial Crude Oil Inventories: ~424.5 million barrels. This is commercial crude held in commercial storage facilities (like the hub at Cushing, Oklahoma), tank farms, and pipelines, excluding the SPR.
- Total Above-Ground Crude Stocks: ~711 million barrels.
2. Underground Proved Crude Oil Reserves
- Total U.S. Proved Reserves: ~46.0 billion barrels (including lease condensate).
- Key Regions: Texas accounts for the largest share of U.S. proved reserves (dominated by the Permian Basin), followed by New Mexico, North Dakota (Bakken), and Alaska. Proved shale plays make up approximately 60% of this total.
According to ExxonMobil’s U.S. Securities and Exchange Commission (SEC) filings, the company holds 19.3 billion oil-equivalent barrels (BOE) in total proved reserves.
Breakdown & Key Details
- Liquids vs. Gas: Over 65% of the portfolio consists of liquids (crude oil, natural gas liquids, bitumen, and synthetic oil), with the remainder in natural gas.
- Proved Undeveloped (PUD): Approximately 7.0 billion BOE (about 36%) are classified as proved undeveloped, representing resources slated for extraction through ongoing capital investment.
- Core Growth Assets: The vast majority of these reserves and future resource additions are anchored in two primary basins:
- The Permian Basin (Texas/New Mexico): Significantly expanded through ExxonMobil’s acquisition of Pioneer Natural Resources, making it the dominant driver of onshore U.S. production.
- Offshore Guyana (Stabroek Block): One of the largest deepwater oil discoveries in decades, holding an estimated resource base exceeding 11 billion barrels.
Yes, both the Atlantic and Pacific oceans contain extensive areas of shallow water, even far from visible coastlines.
These shallow zones fall into three primary geological categories:
1. Continental Shelves & Banks The submerged perimeter of continents forms a shelf that typically stays under 100 to 150 meters deep before dropping steeply down the continental slope.
- Grand Banks of Newfoundland (Atlantic): A massive underwater plateau where depths range from just 25 to 100 meters, famous for centuries of dense fishing grounds.
- Georges Bank (Atlantic): An elevated shelf area off the coast of New England and Nova Scotia where water depths in some spots drop to under 10 meters.
- Great Bahama Bank (Atlantic): Extensive limestone platforms where large swaths of water are only 10 to 25 feet (3 to 8 meters) deep despite dropping thousands of feet off the shelf edges.
- Bering Sea Shelf (Pacific): A vast, shallow plain between Alaska and Russia where water depth averages around 50 to 70 meters across hundreds of miles.
2. Isolated Oceanic Shoals & Shallow Seamounts Volcanic action and tectonic shifting have pushed underwater mountains (guyots and seamounts) up from the abyss, sometimes reaching just below the ocean’s surface.
- Cortes Bank (Pacific): Located approximately 100 miles off the coast of San Diego, California, its shallowest point (Bishop Rock) sits just 3 to 6 feet below the surface at low tide, creating one of the world’s most famous big-wave surf spots out in the open ocean.
- Gorringe Ridge & Gettysburg Seamount (Atlantic): Located off the coast of Portugal, the summit of the Gettysburg Seamount rises to within 20 meters of the surface surrounded by depths of over 4,000 meters.
3. Atolls and Barrier Reefs
- Pacific Atolls: In the South and Central Pacific (such as Tuamotu, the Marshall Islands, and the Coral Sea), coral reefs grow on the rims of sunken extinct volcanoes, creating expansive shallow lagoons that are often only a few feet to several fathoms deep.
The vast majority of both onshore land and offshore seabed in the United States remains untested and undrilled for oil and gas, primarily due to geology, regulatory bans, and economic feasibility.
1. Offshore Lands (Outer Continental Shelf) The federal government, through the Bureau of Ocean Energy Management (BOEM), manages roughly 1.7 to 3.2 billion acres of the Outer Continental Shelf (OCS).
- Tested & Leased: Less than 1% to 2% of total federal offshore acreage is currently leased or has had test wells drilled.
- The overwhelming majority of exploration and drilling is concentrated in the Central and Western Gulf of Mexico (covering roughly 12 to 15 million acres actively under lease).
- Untested / Undeveloped: Over 98% of the OCS has never seen commercial exploratory drilling.
- The Atlantic Coast: Effectively 100% untested in modern times. Apart from a handful of exploratory test wells drilled off New England and the Mid-Atlantic in the late 1970s and early 1980s, federal leasing has been legally banned or excluded from five-year programs.
- The Pacific Coast: Federal waters off California, Oregon, and Washington have had no new lease sales since 1984. Aside from legacy platforms in the Santa Barbara Channel, nearly the entire Pacific margin is untested.
- Offshore Alaska: While geological surveys exist for the Beaufort and Chukchi Seas, the Arctic and Bering Sea basins remain largely undrilled and currently withdrawn from leasing.
2. Onshore Lands Onshore acreage is divided between public lands managed by the Bureau of Land Management (BLM) and private/state lands:
- Federal Mineral Estate: The BLM manages approximately 700 million subsurface mineral acres.
- Leased: Only about 22 to 24 million acres (roughly 3%) are under active oil and gas lease at any given time.
- Untested / Unleased: Roughly 97% of federal subsurface mineral rights have no active oil or gas operations. Large portions are off-limits by law (National Parks, designated Wilderness Areas, military ranges, and wildlife refuges), while others lack the requisite sedimentary geology.
- Private & State Lands: The total U.S. onshore landmass is about 2.3 billion acres. Commercial drilling has occurred on only a tiny fraction (historically less than 5% to 7% of total land area), clustered in prolific hydrocarbon basins like the Permian (Texas/New Mexico), Appian/Marcellus (Northeast), Bakken (North Dakota), and the Western Gulf basin. The remainder has either never been drilled or was ruled out early through surface geology and non-commercial dry holes.
Why So Much Remains Untested
- Geology First: Hydrocarbons only form and accumulate in deep sedimentary basins with specific source rock and trapping mechanisms. Vast areas—such as the Canadian Shield in the northern Midwest, volcanic basalt zones in the Pacific Northwest, or granitic mountain belts—have zero geological potential, so exploration companies never test them.
- Legal and Environmental Moratoria: Federal and state bans strictly prohibit testing across federal waters on both coasts, national parks, marine sanctuaries, and protected monuments.
- Capital Efficiency: Modern seismic reflection (3D/4D imaging) allows operators to “test” subsurface structures with sound waves from the surface or sea level before ever drilling. Rather than wildcat drilling across vast frontiers, companies concentrate their capital where proven infrastructure, pipelines, and refineries already exist.
, Donald Trump is not planning to drain the nation’s oil reserves; official administration policy is aimed at refilling the Strategic Petroleum Reserve (SPR) to full capacity.
The current landscape of the SPR and the policies surrounding it involve several critical dynamics:
1. Stated Administration Policy: Refill to Maximum Capacity
- “Topping Out” the Stockpile: President Trump and the Department of Energy (DOE) have repeatedly characterized the depleted reserve as a national security vulnerability, stating their goal is to refill the SPR “right to the top” (roughly 714 million barrels of capacity).
- New Supply Channels: The administration recently announced plans to use crude sourced through new agreements—including a bilateral energy framework with Venezuela—to restock the salt caverns at low cost without solely relying on domestic market purchases.
2. Why the SPR Is Near Historic Lows
- 2022 Drawdowns: The reserve was initially drawn down by 180 million barrels under the Biden administration following Russia’s invasion of Ukraine to curb surging gasoline prices.
- Middle East Disruptions: In early 2026, the Trump administration coordinated an additional loan/release of crude with the International Energy Agency (IEA) to stabilize domestic fuel supplies amid geopolitical conflict and maritime transit halts in the Persian Gulf.
- Current Inventory: Because of these combined emergency actions, the reserve currently sits at roughly 286 million barrels—its lowest level in over four decades.
3. Operational & Legal Floors Prevent “Emptying” the Reserve
- Federal Law: Under the Energy Policy and Conservation Act (EPCA), routine or non-emergency sales are legally restricted once the SPR drops below ~252 million barrels.
- Physical Constraints: Cavern integrity in the underground salt domes requires a minimum base layer of brine and crude. Petroleum engineers note that drawing below approximately 200–250 million barrels risks geological structural damage to the salt caverns, meaning the stockpile cannot be physically drained to zero without destroying the facility infrastructure.
U.S. Energy Secretary Chris Wright argued that Democratic policies—both federally and at the state level—have driven refinery closures, reducing domestic fuel processing capacity and increasing energy costs.
Washington Examiner
The debate over refinery closures centers on regulatory pressure versus underlying market and economic factors.
The Policy & Regulatory Argument
- Regulatory Compliance Costs: Critics point to stringent emissions standards, mandates under programs like California’s Low Carbon Fuel Standard and cap-and-invest system, and federal EPA rules, arguing they impose heavy compliance costs that make aging facilities unprofitable. YouTube
- Long-Term Demand Signals: Policies mandating future phase-outs of internal combustion engines create a strong disincentive for oil companies to make the major capital expenditures required to maintain or upgrade traditional processing units.
- State-Level Scrutiny: Heavy focus is often directed at California, where refiners like Phillips 66 and Valero announced facility shutdowns or conversions, reducing West Coast capacity and increasing reliance on imported fuel. EIA
Market and Economic Factors
- Demand Drop During COVID-19: A significant wave of closures occurred between 2020 and 2021 when global demand for transportation fuels cratered, forcing operators to permanently decommission older, less-efficient facilities.
- Conversion to Renewable Diesel: Rather than shutting down entirely due to government orders, several operators chose to convert conventional petroleum refineries into reŵ
- newable diesel facilities to capture clean fuel subsidies and tax credits.
- Operational Age and Facility Damage: Several shut-downs followed severe weather incidents (such as Hurricane Ida) or fires (like the 2019 Philadelphia Energy Solutions explosion), where the cost of rebuilding damaged, decades-old infrastructure could not be justified by the refiners.
- Global Competition: Newer, mega-scale refining complexes in Asia and the Middle East operate with lower overhead, putting sustained margin pressure on older, smaller U.S. coastal facilities.
The world is not facing a structural physical shortage of crude oil in the ground; rather, it periodically faces acute logistical panics and refining bottlenecks layered over an otherwise well-supplied global market.
Depending on where you look—day-to-day headlines versus underlying market data—the picture looks very different.
Why It Feels Like the World Is Desperate
- Chokepoint Vulnerability: When geopolitical conflicts flare around corridors like the Strait of Hormuz or the Red Sea, millions of barrels per day are suddenly trapped or rerouted. Because global supply chains run on “just-in-time” deliveries, even temporary tanker disruptions trigger immediate price spikes and localized shortages. IEA
- The Refining Squeeze: Having crude oil in a storage cavern does no good if you cannot turn it into usable diesel, jet fuel, or gasoline. A lack of complex refining capacity in key consumer regions means finished product prices often skyrocket even when crude supplies are stable.
- Sticky Everyday Demand: While transitions to electric vehicles and renewables are accelerating in passenger transport, heavy industry, commercial shipping, aviation, and petrochemicals still have few scalable near-term substitutes.
What the Supply Numbers Actually Show
- Surplus Production Capacity: Outside of acute crisis moments, major producers have significant spare pumping capacity. OPEC+ members have spent recent years deliberately withholding millions of barrels a day from the market specifically to prevent global gluts and price collapses.
- Americas Boom: Production outside the Persian Gulf has surged to record volumes. The United States remains the largest crude producer in the world, with additional output expansion coming out of Guyana, Brazil, and Canada. IEA
- Slowing Demand Growth: In mature economies and parts of East Asia, overall oil demand growth has flattened due to efficiency gains, alternative energy adoption, and shifts in industrial activity.
The global market generally alternates between two realities: long periods of oversupply managed by producer production caps, punctuated by sharp, volatile panics whenever transport routes or refineries get cut off.
IEA
Yes, countries, industries, and entire populations have repeatedly faced situations where they physically could not get enough fuel to function, forcing emergency rationing, power cuts, and economic standstills.
While the modern global economy rarely sees an advanced nation run completely dry of oil, severe physical shortages have happened across several notable eras.
Wartime Deprivation
- Japan and Germany in World War II: The most extreme historical examples of running out of oil occurred during WWII. Following the 1941 U.S. oil embargo, Japan’s military and merchant marine faced catastrophic fuel deficits that dictated naval strategy and ultimately grounded air fleets. By late 1944 and 1945, Germany’s mechanized divisions and Luftwaffe were immobilized because synthetic fuel plants and refineries had been bombed out of service.
- Cuba’s “Special Period” (1990s): When the Soviet Union collapsed, Cuba lost roughly 80% of its subsidized oil imports almost overnight. The country experienced catastrophic fuel shortages: public transport largely vanished, agricultural tractors sat idle without diesel, rolling blackouts lasted 16 hours a day, and the country was forced to transition to draft animals and bicycles to survive.
Peacetime Chokepoints and Crises
- The 1973 OPEC Embargo: Arab members of OPEC cut production and embargoed crude to nations supporting Israel during the Yom Kippur War. In the U.S. and Western Europe, physical supplies dropped enough to cause genuine local stockouts: gas stations ran dry, odd-even license plate rationing was instituted, highway speed limits were cut to 55 mph to save fuel, and motorists waited in multi-mile lines.
- The 1979 Iranian Revolution: Global oil production dropped roughly 4% to 5% following widespread strikes and political upheaval in Iran. Panic buying stripped service stations again in North America and Europe, stranding commuters and forcing long lines at the pumps.
Developing Nations and Modern Financial Shortages
- Sri Lanka (2022): The island nation completely exhausted its foreign currency reserves and could not pay for fuel shipments. Thermal power plants shut down, filling stations ran out entirely for weeks, and the government banned fuel sales to non-essential vehicles, effectively shuttering schools and public offices.
- South Asia and Developing Importers (2022–2023, 2026): Whenever global crude and diesel prices spike due to maritime disruptions or conflict, developing nations like Pakistan and Bangladesh are frequently priced out of international spot cargoes. The result is not that oil doesn’t exist in the world, but that specific countries physically cannot secure enough refined diesel and fuel oil to keep their power grids and trucks running. Press Trust of India
In practice, the modern world avoids total exhaustion through price spikes: when oil gets scarce, it becomes so expensive that the poorest consumers and weaker economies are simply forced to stop buying, absorbing the shortage so wealthier buyers still get by.


You must be logged in to post a comment.